Observations with SST and IRIS

RoCS has an agreement with the Institute for Solar Physics in Stockholm which gives us observing time at the Swedish 1-m Solar Telescope (SST), located at the Roque de los Muchachos Observatory on La Palma in the Canary Islands.

By Luc Rouppe van der Voort
Published Aug. 31, 2026
Two close-up images of the same sunspot observed at different wavelengths. The top orange image shows the sunspot in the photosphere with a dark central region and radiating streaks. The bottom blue image shows the sunspot in the chromosphere with bright, filament-like structures spreading outward.

Sunspot observed with CHROMIS (22-Sep-2017). The top panel shows the photosphere, imaged with the CHROMIS wideband channel at a wavelength of 395 nm, and the bottom panel shows the chromosphere, imaged with CHROMIS in the Calcium K line at a wavelength of 393.3 nm.

The observing time is usually spread over three two-week campaigns from spring until autumn. These campaigns are very much a team effort, and many members from the RoCS team participate in these observations. All observations are coordinated with the IRIS satellite, which involves daily interaction with the IRIS planners to decide which target to observe and which observing program to run. 

In the past few years, we have also coordinated with ESA's Solar Orbiter mission. The Sun has been very active in recent years, and we have successfully observed flares and other eruptive phenomena in active regions. 

The observations with IRIS from space gives us access to the higher parts of the solar atmosphere: the upper chromosphere and transition region. With the SST, we can observe the deeper parts of the atmosphere — the photosphere and lower chromosphere — in extreme detail. Solar Orbiter can observe the solar corona at extremely high spatial and temporal resolution. Coordinated observations with all these telescopes and instruments give a more complete view of the solar atmosphere than one can achieve with a single instrument alone.  

Besides planning and acquiring new observations, the reduction and data processing of current and earlier observations are among the main activities of the observations group. We employ image restoration techniques to mitigate the effect of atmospheric turbulence (so-called “seeing”) on the data quality. 

Like all modern telescopes, the SST employs an adaptive optics system to correct for seeing in real time during the observations. Adaptive optics provides a significant improvement in data quality, but post-facto image restoration is mandatory to attenuate residual seeing deformations. With image restoration, high data quality can be achieved over a larger field of view and over longer periods of time. Besides considerable computing power and data storage capacity, data reduction requires a fair amount of manpower and is handled as a team effort. We collaborate with the SST staff in Stockholm and La Palma to improve, optimise and further develop the data processing pipelines for the CRISP and CHROMIS instruments.
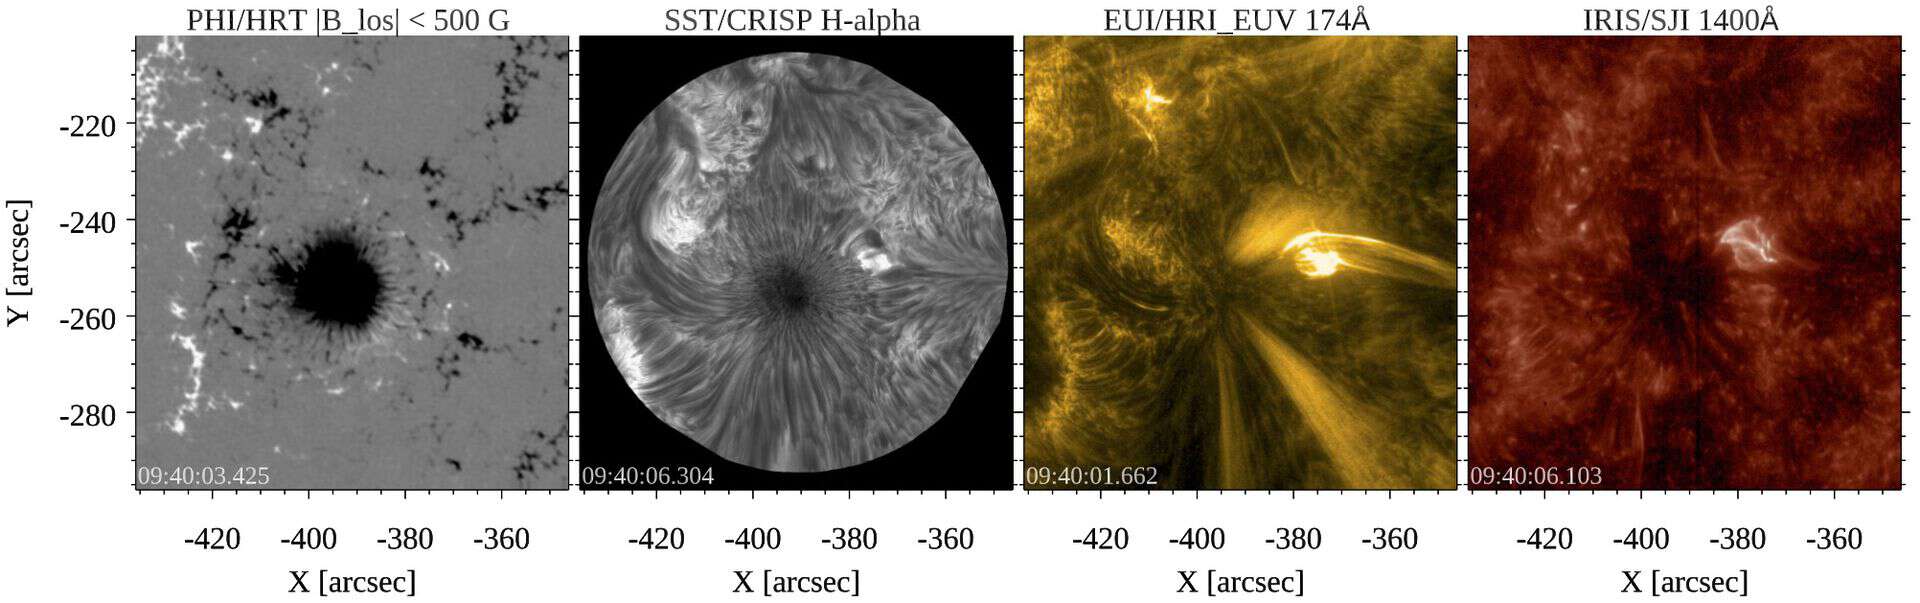
Four panels show the same solar region seen with different instruments. Left: a grey magnetogram with a dark, strong‑field patch in the center. Second: a greyscale H‑alpha image with fine, thread‑like structures around the center. Third: a yellow extreme‑ultraviolet image with a bright, narrow jet of plasma curving to the right. Fourth: a red ultraviolet image with more diffuse, filament‑like structures in the same area.  Below the panels, the caption reads: “Large jet observed during a coordinated campaign in October 2023 involving SST, Solar Orbiter, and IRIS. From Joshi, Rouppe van der Voort, Aulanier et al. (2026, A&A, 706, A369).
Large jet observed during a coordinated campaign in October 2023 involving SST, Solar Orbiter, and IRIS. From Joshi, Rouppe van der Voort, Aulanier et al. (2026, A&A, 706, A369).
Active solar region observed by IRIS and SST on 29 September 2020, shown in six panels at different wavelengths: Si IV, Mg II k, Hα, white light, Fe I 6173 Stokes V, and Ca II 8542.  The two left panels (Si IV and Mg II k) from IRIS show the larger solar area, with the green square highlighting the region covered by the high‑resolution SST images on the right. The four right panels (Hα, white light, Fe I Stokes V, and Ca II) resolve finer structures such as sunspots, magnetic features, and small‑scale brightenings, allowing a direct comparison of how the same solar region appears in different diagnostics.
Active region observed by IRIS and SST on 29 September 2020. On the left are two large rasters in the Is IV 139.4 nm and Mg II k line cores, constructed from well-exposed IRIS spectrograph data taken over the time of 2 hours and 40 minutes. The green square marks the area covered by SST shown in the images on the right.
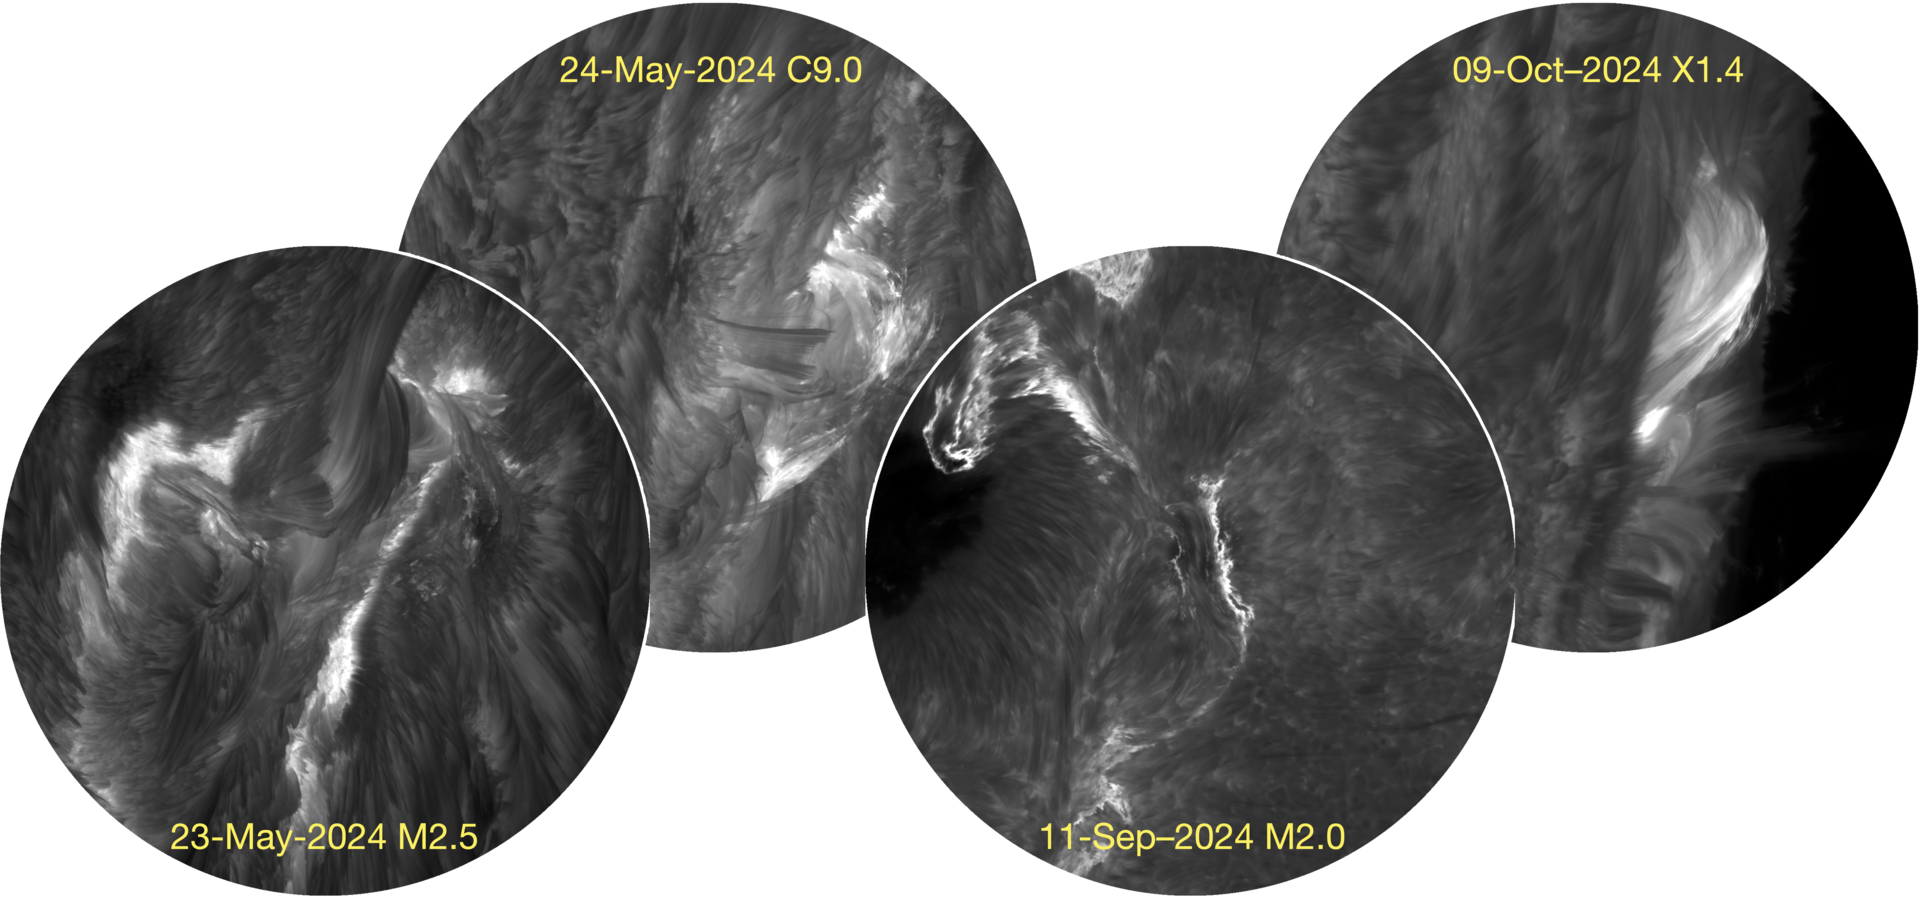
Four circular greyscale images show solar flares with bright, twisted structures in the Sun’s atmosphere. Each circle is labeled with the flare date and class: 23‑May‑2024 M2.5, 31‑May‑2024 C9.0, 11‑Sep‑2024 M2.0, and 09‑Oct‑2024 X1.4.
Four different solar flares of different strength observed with the CRISP instrument at the SST during the 2024 observing season.
Published Aug. 31, 2026 9:48 AM - Last modified Sep. 1, 2026 2:04 PM