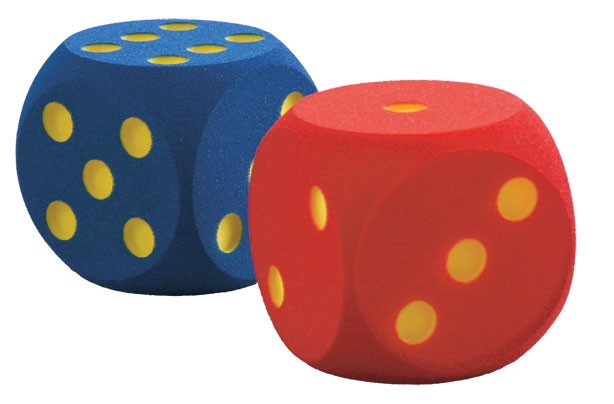
You roll the blue die 79 times and get a six 22 times. Then you roll the red one 78 times and get six 19 times. Is there really a difference?
High Drama
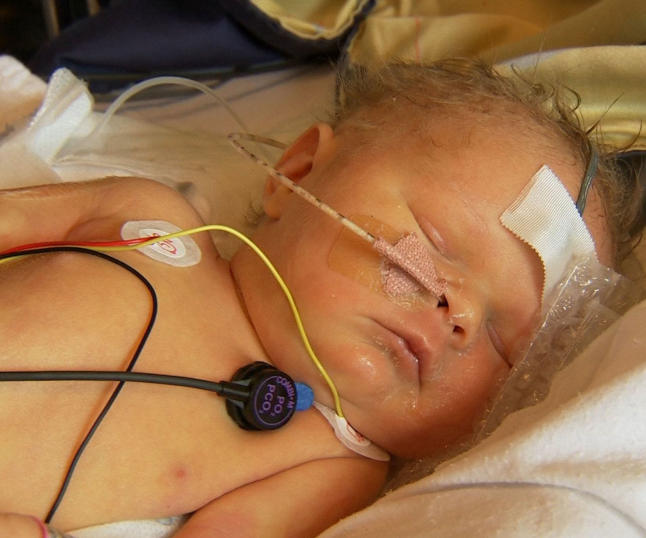
Without going into the drastic physiological details, in some rare cases newborns are being critically deprived of oxygen to the brain as a consequence of a difficult birth. Pioneering research, involving in particular Professor of Systems Physiology and Neonatal Neuroscience Marianne Thoresen from the Universities of Oslo and Bristol, has demonstrated that a form of cooling, where the little body has its temperature lowered to 33º Celsius during a certain period just after birth, can save its life, and with no loss of later mental or motoric capacities. There is ongoing research and controversy, however, regarding the time window where the cooling operation is helpful, or useless, or too late.
This blog post relates to a study very recently reported on in the prestigious Journal of the American Medical Association (Laptook et al., October 2017). It is my Statistical Story version of ongoing joint work with Lars Walløe (chemist, physiologist, scientific adviser to the Norwegian government, expert on issues ranging from the plague to whales, etc.) and Marianne Thoresen (check out the TV2 programme on her work).
The JAMA authors analysed various aspects of cooled and noncooled newborns, where each case involved oxygen deprivation during birth, and where the cooling action, if taken, was initiated inside the time window 6 hours to 24 hours after birth (as opposed to starting earlier, which has been the general recommendation, so far). There are quite a few neonates with encephalopathy caused by lack of oxygen, per year, in both the US and in Europe, and where 72 hours of cooling is initiated before 6 hours after birth. In somewhat rare cases one misses this time window, however, and the newborns having entered the Laptook et al. study stem from such cases.
The study has involved several monitoring processes and recording of relevant aspects. I shall avoid various extra details here and concentrate on a simple $2\times 2$ table for two binomials, which is also the basis for the main statistical story of the Laptook et al. paper:
\(\eqalign{ y_0\sim{\rm bin}(m_0,p_0), &\quad \hbox{for a group of noncooled newborns}, \cr y_1\sim{\rm bin}(m_1,p_1), &\quad \hbox{for a group of cooled newborns}. \cr}\)
The event in question is death or disability (with a precise definition of disability, assessed when the child is about 18 months old).
So we're back to the two coloured dice example above: there were 22 of 79 cases in the noncooled group and 19 of 78 cases in the cooled group.
The JAMA article is important, summing up crucial information from drama-filled data for oxygen deprived newborns collected over eight years. Instead of telling readers up front that the main finding is that cooling initiated later than after 6 hours does not work better than doing nothing, which appears very clearly to be the case (we can't claim there is any probability difference for the blue and the red dice), they launch into Bayesian story telling modus, where too much depends on the chosen priors. The paper appears to push readers into accepting that there is something there, after all, in the perhaps hoped-for direction of $p_1<p_0$ (apply your favourite Fata Morgana colour here) – wenn $p_1$ kleiner wäre als $p_0$ (the conjunctive is less visible in English), it would be good for the hypoxic-ischemic neonates, since it would mean more time on the hands of the physicians and mothers and indeed newborns. There are clearly potentially drastic consequences down the road, for how clinicians handle these life-threatening cases, (a) if $p_1$ were to be found measurably smaller than $p_0$, because lives could be saved with less stress for time; and (b) if clinicians start thinking that (a) is true when it is not.
So let's look at the setup, the arguments, the analyses, the interpretations, the consequences.
Frequentist Inference
I do believe the famous and suitably randomised Man & Woman in the Street would agree that there is no real, genuinely notable difference between the blue die and the red die. In fact I think even 99% of all statisticians would agree (even without crunching a zillion numbers or running to their $\chi^2_1$ tables or to Fisher's 1922 paper). Statisticians have of course dozens of way of expressing there's no real difference, including concepts and terms like p-value, testing, null hypothesis, significance, confidence. One of the simpler ways for assessing such things is to give the natural point estimates, $\hat p_0=22/79=0.278$ and $\hat p_1=19/78=0.244$, along with the traditional (approximate) 95% confidence intervals, via the $\pm1.96\,\{\hat p(1-\hat p)/m\}^{1/2}$ formula, leading to $[0.180,0.378]$ for $p_0$ and $[0.148,0.339]$ for $p_1$. The very clear overlap indicates that indeed there is no reason to throw away the idea that $p_0$=$p_1$ here, i.e. the null hypothesis.
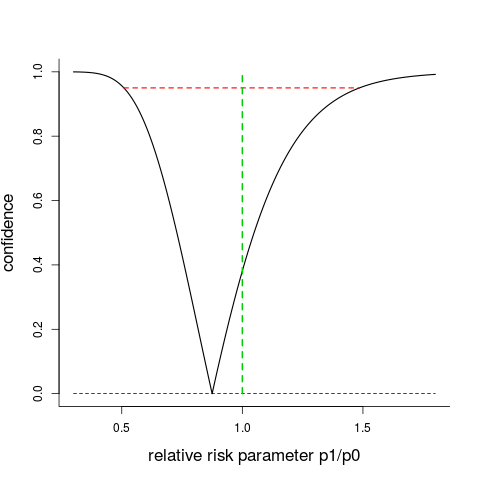
A more informative way of summarising what we know concerning the two key probabilities $p_0$ and $p_1$ is via their confidence curves ${\rm cc}(p_0)$ and ${\rm cc}(p_1)$ displayed below; these point to the point estimates 0.278 and 0.244, and confidence intervals at all levels can be read off.
The JAMA paper focuses on rr = $p_1$/$p_0$, the relative risk, or risk ratio. Using statistical recipes for confidence curves developed in Schweder and Hjort's CLP book, I can also compute the cc(rr) given in the figure below. It points to the estimate $\hat p_1$/$\hat p_0$=0.875, giving also confidence intervals at all levels; the 95% interval is $[0.509,1.485]$, with the null hypothesis value $\hbox{rr}=1.00$ smack in the middle of the soup. There is clearly no good reason, judged from the $2\times2$ table of outcomes, to claim that $p_1$ (probability of bad outcome for cooled-after-six-hours) is different from $p_0$ (probability of bad outcome for noncooled). In fact, all confidence intervals with level at least 38.1% include the no-difference-at-all value $\hbox{rr}=1.00$, and the p-value 0.619 from a standard Wilks $\chi^2_1$ test matches this.
Bayesian Inference
The above type of analyses, called perhaps traditional, or classical, or frequentist, tell us, in various ways, that we're far off from having any reason to claim that $p_1$ is different from, or indeed smaller han, $p_0$. The extra handle for the JAMA analyses is that of allowing prior knowledge, or prior views, into their calculations, i.e. using the machinery of Bayesian statistics. With prior densities $\pi_0(p_0)$ and $\pi_1(p_1)$ one computes the posterior densities $\pi_0(p_0\,|\,\hbox{data})$ and $\pi_1(p_1\,|\,\hbox{data})$, which then leads to a clear posterior distribution for the primary focus parameter rr = $p_1$/$p_0$, and also for other quantities of interest. The figure below shows the Bayes machinery at work, for the present data, (a) for what Laptook et al. term a neutral prior (from red full to black full curve), (b) for what they term an enthusiastic prior (from red slanted to black slanted curve). The neutral prior is a log-normal with parameters $(0, 0.35^2)$, with median 1.00 on the rr scale; the enthusiastic prior is another log-normal with parameters $(-0.328,0.35^2)$, with median 0.72 on the rr scale. The two black curves are not very different, reflecting the fact that data information tends to dominate priors, unless the prior is sharp, or the data quality low, or both. More importantly, in this dramatic context, the null hypothesis value rr = 1 is still smack in the middle of the porridge, both for the allegedly neutral and the enthusiastic.
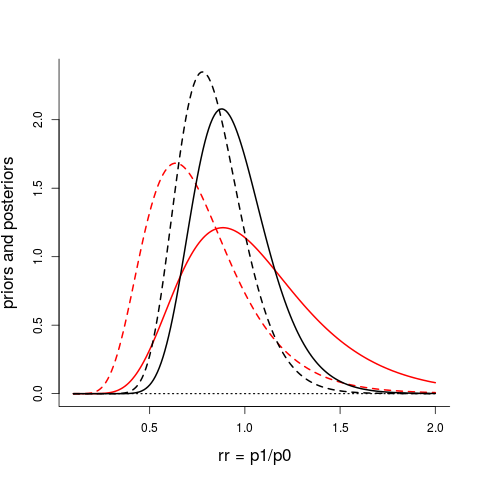
Red full curve to black full curve: neutral prior (median 1.00 on rr scale) and its posterior. Red slashed curve to black slashed curve: enthusiastic prior (median is 0.72 on rr scale) and its posterior. Laptook et al.'s Figure 2 give a similar picture for the neutral prior and its posterior, but their curves can't be quite correct (the log-normal is skewed to the right, whereas their curves look symmetric).
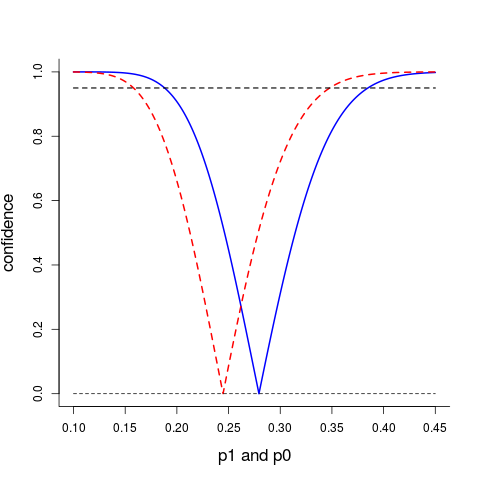
I give you one more figure showing the Bayesian apparatus at work. Laptook's neutral prior is not really neutral, when carefully examined; its median value is indeed the neutral rr = 1.00, but both the shape and the spread matter. Below I've first plotted the cumulative distribution for the allegedly neutral prior (red, slashed), along with its updated posterior cumulative (black, dotted). In a statistical sense this neutral prior is quite informative, and one's opinion is not changed very much after the eight years of troubled neonates. The full black curve is the cumulative posterior stemming from what most Bayesians would agree on are sensible noninformative priors for $p_0$ and $p_1$, namely the so-called Jeffreys priors (which here are Beta densities with parameters $({1\over 2},{1\over 2})$). Once again, the null hypothesis value rr = 1, or $p_1$=$p_0$, is smack in the middle of the stew. The posterior probability for $p_1$ < $p_0$ is 0.690, which is in the category of statistically underwhelming results if one is hoping to learn that cooling is better than noncooling for newborns more than 6 hours old.
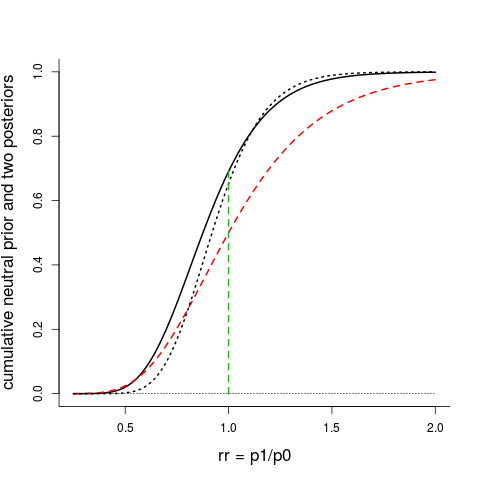
The cumulative prior for Laptook's allegedly neutral prior (red, dashed), leading to the cumulative posterior (black, dotted), which is close to the cumulative posterior coming from the Jeffreys priors for the two binomials (black, full).
Bayes vs Frequentist – for the $(n+1)$-st time
No, I'm not anti-Bayesian (I teach Bayes and publish Bayes, and am frequently contributing to Bayesian nonparametrics), and this blog post is not anti-Bayes, per se. Neither do I wish my blog post to be seen as yet another Frequentist vs. Bayesian showdown. I choose to disagree with certain Bayesian-related issues in the way Laptook et al. package their findings, however, and I worry that Bayesian tools might be misused, or misinterpreted, or lead to probability calculations which in certain contexts are unnecessary, or artificial, or are less precise than they appear to be.
In another FocuStat blog post, Tore Schweder points out how an innocent looking prior can be much more influential than even a Nobel Laureate (well, recipient of Sveriges riksbanks pris i ekonomisk vetenskap til Alfred Nobels minne, to be pedantically correct) thinks it is, leading to potentially erroneous conclusions. Similarly, Laptook et al.'s neutral prior is more informative than it sounds (see above). Another issue exposed here is that the Bayesian setup might invite computing seemingly precise answers to noncentral questions. Their summary line
"The probability that death or disability in cooled infants was at least 1%, 2%, or 3% less than noncooled infants was 71%, 64%, and 56%, respectively"
is a case in point. I admit the statement isn't entirely clear to me (even when I tentatively put in "for" in front of "noncooled") – but I translate it into calculations for
$P(p_1 \le 0.99\,p_0\,|\,\hbox{data})$, $P(p_1 \le 0.98\,p_0\,|\,\hbox{data})$, $P(p_1 \le 0.97\,p_0\,|\,\hbox{data})$,
where mathematically precise Bayesian calculus indeed give answers. But the sirenic allure of mathematical formulae might lead one to give these numbers too much credibility. Changing the $y_1=19$ number of bad cases for the cooled group to 18 or 20 changes these numbers significantly – and they still depend on the prior used.
More relevant, given the context, would be to compute the probability that cooling after 6 hours is better than noncooling, say
$Q(y_1)=P(p_1<p_0\,|\,y_0=22,y_1)=\int_0^1 G_1(p_0\,|\,y_1)g_0(p_0\,|\,y_0)\,{{\rm d}}p_0$
for a range of values of $y_1$ (with $G_1$ and $g_0$ denoting the posterior cumulative and posterior density for $p_1$ and $p_0$, respectively), compared with the actual and not impressive value $Q(19)=0.690$. With the canonical neutral Jeffreys priors, we learn that only with $y_1=13$ or less is the probability on the perhaps statistically impressive level of the famous 0.95 or higher.
Computing such $Q(y_1)$ probabilities completely without priors can incidentally be accomplished, essentially assessing the epistemic distribution of rr = $p_1$/$p_0$ given the data, via confidence distribution methods of Schweder and Hjort (2016). This is related to the confidence curve displayed above.
To boil down the crucial data-model-probability-statistics issues to a simple prototype question, suppose there is a theory claiming that the distribution of certain random variables $y$ is the standard normal, and suppose you observe $y=0.303$. The probability of falling to the left of this value, under that theory, is 0.619, the p-value associated with $p_1$=$p_0$ in the Laptook data case. Every student in a Bayesian course may then go calculating, starting from the model ${\rm N}(\theta,1)$ with some prior on $\theta$, and updating this after seeing $y=0.303$, etc. But should you reject the standard normal assumption? Surely not.
There is More
Therapeutic hypothermia is a sophisticated treatment for the oxygen deprived neonates. More details, regarding aspects and findings for different therapeutic regimes, can be found in journal articles by Marianne Thoresen and her coworkers. It remains very important to define the effective time window for such treatment, also for the clear reason that many newborns cannot be transported to a cooling centre within six hours.
I do not have access to other parts of the data collected by the Laptook et al. study. It would be of interest to check, via logistic regressions or otherwise, to what extent outcomes might depend on the natural extra informant $x$, the precise number of hours after birth the cooling regime was initiated.
Where do the priors come from? The Bayesian paradigm is famously or infamously flexible for this point, almost on the level of `anything goes'. A good, informed prior should however come from previous relevant data, or from solid quantifiable prior knowledge. For the neonates issues, there is some prior information indicating that cooling will not work, and might even be deleterious, when initiated after a certain time window; see the Sabir et al. (2012) paper. This would translate into an informed, skeptical prior for the focus parameter rr = $p_1$/$p_0$.
A somewhat grander theme, worth discussing more broadly, is the role of Bayesian statistics for clinical trials, along with a better understanding of classes of and the role of priors in such contexts (where one of the lessons learned is that an alleged neutral prior might be more informative than one thinks). One might also attempt to delineate better the line between categories (A), `Bayes with priors have a relevant and important role to play', and (B), `Bayes with priors risks adding confusion and bias to questions best answered by classical frequentist methods'. This has to do not merely with statistical formulas and calculations but with effective, context relevant scientific communication, to specialists, to the envisaged users, and to a broader audience. It is my view for the particular case discussed in this blog post that the cooled and noncooled newborns are in category (B), not (A) – even if this puts me in partial disagreement with both Laptook et al. and my statistician colleagues Quintana, Viele and Lewis (who advocate Bayes for clinical trials, in the same issue of JAMA).
Acknowledgement
I appreciate discussions on both subject matter, methodology, and presentation, with Lars Walløe, Marianne Thoresen, Céline Cunen, Emil Stoltenberg, and the other FocuStat group members. I further applaud the efforts of my 19 master's level and 6 PhD students who took my somewhat demanding Bayesian Statistics course this autumn, and who for their ten-day December 2017 exam project report had to write up their analyses and interpretations pertaining to a list of questions related to the Laptook et al. October 2017 article.
References
Hjort, N.L., Holmes, C., Müller, P. and Walker, S.G. (2010). Bayesian Nonparametrics. Cambridge University Press.
Hjort, N.L. (2017). Exam Project for the Bayesian Statistics course STK 4021 / 9021, Department of Mathematics, University of Oslo (where the students were given ten days to answer various points regarding the Laptook issues).
Hjort, N.L. and Schweder, T. (2017). Confidence distributions and related themes. General introduction article to a Special Issue of the Journal of Statistical Planning and Inference (to appear), dedicated to this topic, with eleven articles, and with Hjort and Schweder as guest editors.
Laptook, A. (with 35 co-authors) (October 2017). Effect of therapeutic hypothermia initiated after 6 hours of age on death and disability among newborns with hypoxic-ischemic encephalopathy: A randomized clinical trial. Journal of the American Medical Association.
Quintana, M., Viele, K. and Lewis, R.H. (October 2017). Bayesian analysis: Using prior information to interpret the results of clinical trials. Journal of the American Medical Association (JAMA Guide to Statistics and Methods).
Sabir, H., Scull-Brown, E., L, X., and Thoresen, M. (2012). Immediate hypothermia is not neuroprotective after severe hypoxic-ischemia and is deleterious when delayed by 12 hours in neonatal rats. Stroke.
Schweder, T. and Hjort, N.L. (2016). Confidence, Likelihood, Probability. Cambridge University Press.
Walløe, L., Hjort, N.L. and Thoresen, M. (November 2017). Important data on effects of late hypothermia. (Discussion of the Laptook et al. article.)
Log in to comment
Not UiO or Feide account?
Create a WebID account to comment