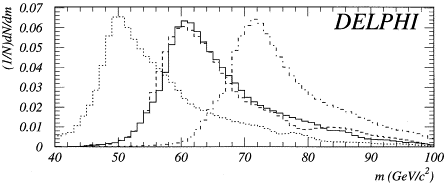
If the two histograms in the example in the article (see Fig.1) are hist60 and hist70, representing the invariant mass distributions of a hypothetical particle with mass 60 or 70 GeV, respectively, then the interpolated histogram hist65 may be created with:
TH1F *hist65 = (TH1F *)th1morph("hist65","Interpolation to 65 GeV",hist60,hist70,60,70,65);
Some examples, in the form of simple animations, serve to illustrate the successful interpolation between 2 Gaussian distributions (execute the root macro gausfilm.C) and between 2 exponential distributions (execute the root macro expfilm.C). The examples assume you have previously downloaded th1fmorph.C .
One should always test the interpolation by comparison of an interpolated histogram to a regular histogram (say you have parameter-ordered histograms A, B, C - compare the interpolation between A and C at the value of the parameter to which B corresponds to B itself and check that it makes sense).
To illustrate the limitations of the method, an amusing failure to interpolate between 2 Gaussian distributions on top of a large, exponential background is provided (execute the root macro bumpfilm.C).
The beginning of the macro documents the arguments in some more detail:
TH1F *th1fmorph(Char_t *chname="TH1F-interpolated",
		Char_t *chtitle="Interpolated histogram",
		TH1F *hist1,TH1F *hist2,
		Double_t par1,Double_t par2,Double_t parinterp,
		Double_t morphedhistnorm=1,
		Int_t idebug=1)
{
  //--------------------------------------------------------------------------
  // Author           : Alex Read
  // Version 0.1 of ROOT implementation, 05.05.2011
  // *
  // *      Perform a linear interpolation between two histograms as a function
  // *      of the characteristic parameter of the distribution.
  // *
  // *      The algorithm is described in Read, A. L., "Linear Interpolation
  // *      of Histograms", NIM A 425 (1999) 357-360.
  // *
  // *      This ROOT-based CINT implementation is based on the FORTRAN77
  // *      implementation used by the DELPHI experiment at LEP (d_pvmorph.f).
  // *      The use of double precision allows pdf's to be accurately
  // *      interpolated down to something like 10**-15.
  // *
  // *      The input histograms don't have to be identical, the binning is also
  // *      interpolated.
  // *
  // *      Extrapolation is allowed (a warning is given) but the extrapolation
  // *      is not as well-defined as the interpolation and the results should
  // *      be used with great care.
  // *
  // *      Data in the underflow and overflow bins are completely ignored.
  // *      They are neither interpolated nor do they contribute to the
  // *      normalization of the histograms.
  // *
  // * Input arguments:
  // * ================
  // * chname, chtitle : The ROOT name and title of the interpolated histogram.
  // *                   Defaults for the name and title are "THF1-interpolated"
  // *                   and "Interpolated histogram", respectively.
  // *
  // * hist1, hist2    : The two input histograms.
  // *
  // * par1,par2       : The values of the linear parameter that characterises
  // *                   the histograms (e.g. a particle mass).
  // *
  // * parinterp       : The value of the linear parameter we wish to
  // *                   interpolate to.
  // *
  // * morphedhistnorm : The normalization of the interpolated histogram
  // *                   (default is 1.0).
  // *
  // * idebug          : Default is zero, no internal information displayed.
  // *                   Values between 1 and increase the verbosity of
  // *                   informational output which may prove helpful to
  // *                   understand errors and pathalogical results.
  // *
  // * The routine returns a pointer (TH1F *) to a new histogram which is
  // * the interpolated result.
  // *
  // *------------------------------------------------------------------------