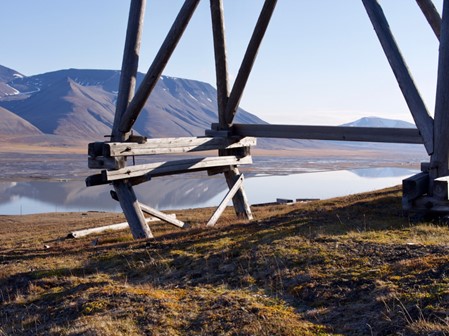
The Arctic is the fastest warming region on Earth, with multiple impacts of climate change already affecting people's lives. Thawing permafrost destabilises the soil, leading to an increased risk of landslides, and damage to buildings, infrastructure and cultural heritage objects.
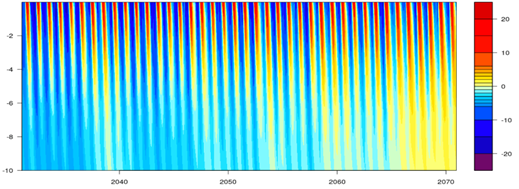
Svalbard, with its steep topography, valleys and glaciers, is not well represented in global climate models. We have recently completed regional climate simulations covering Svalbard in 2.5 km resolution for 80 years continuously, which opens up possibilities of studying changes in permafrost under a future climate change scenario.
The student will be part of the CryoGrid model community and learn to run permafrost simulations at local scales. A collaboration with researchers from the Meteorological Institute is in place to enable the student to use climate model data and future projections.
Research questions and suggested methods:
- How well do climate models represent permafrost on Svalbard? Using model data and comparing with existing measurements.
- How does permafrost variability change in space and time in the future scenario? With particular attention to soil and slope heterogeneity.
- What are the impacts of different parts of the modelling chain from global to regional climate modelling and offline permafrost modelling? Which processes are most crucial to more closely represent observed permafrost changes? Comparing global and regional model data with new CryoGrid simulations, potentially also including sensitivity experiments with different parameterisations for segregation ice and different soil conditions.
The student is required to have skills in programming/scripting (Matlab/Python/R/shell) and a good understanding of permafrost processes.