Data analysis and manuscript in progress
July 27, 2016
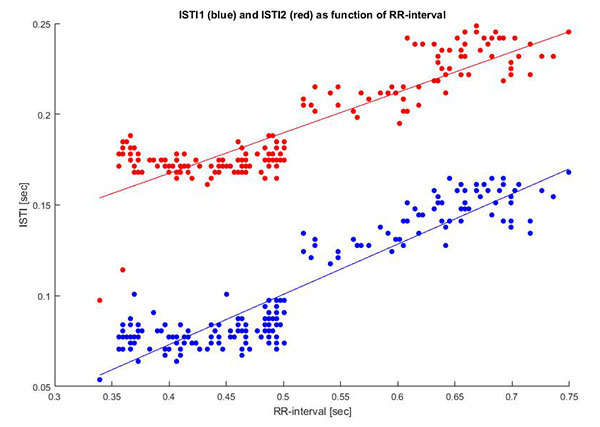
All measurements have been done and the data analysis and writing of the article is in progress. Here is an example of data from a subject in the younger group. The blue dots are data from the chest and the red are from the upper arm. The time delay is close to 100 ms.
Measurements have started
December 1, 2015
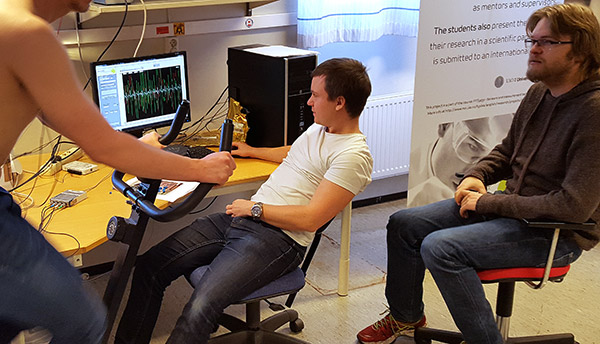
The first measurements have been conducted and we are recruiting volunteers.
ICG instruments
November 2, 2015
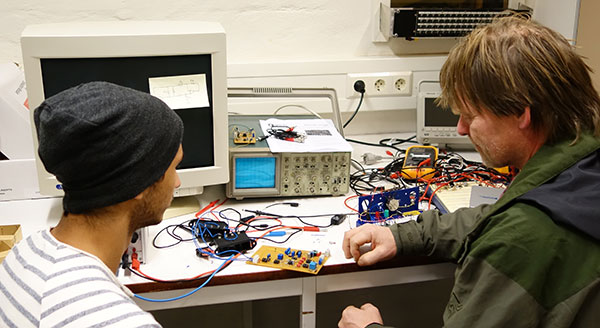
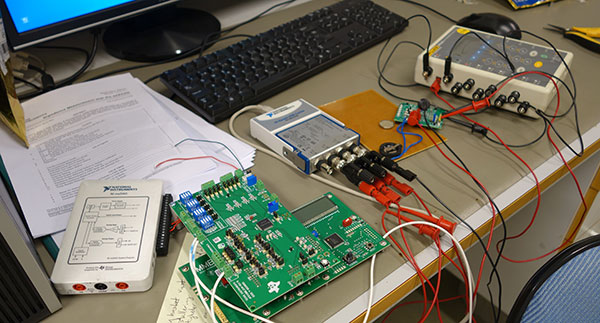
Construction of the instruments has been the main focus for the last weeks. Three different solutions have been tried and all of them show promising results. However, due to the very strict time schedule in this project, it was decided to move on using the instruments built in Amsterdam. Instead, the prototypes built by the students will serve as pilot constructs for future master projects in this field.
Statistics
September 29, 2015
 |
Cristian Tronstad gave a lecture on statistics and power analysis. This will be useful both when choosing the number of volunteers for each age group and for analysing the the measured data for any differences between the age groups. |
Real measurements
September 23, 2015
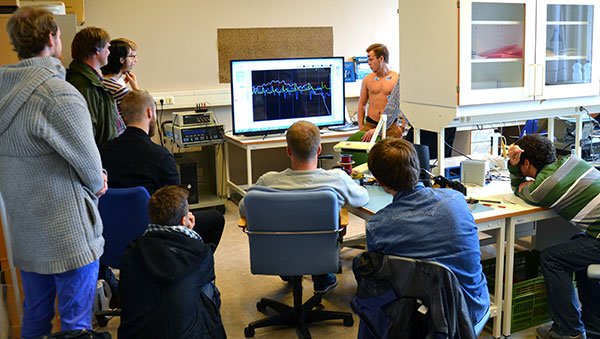
Dr. Jan H. Meijer had brought one of his ICG instruments from Amsterdam to show the students what the measurements should look like and we had a very nice session on the lab. Thanks to Oliver and Vegard for helping out with the practical setup! Ole Martin became famous for having very nice C-waves.

Cardiology
September 23, 2015
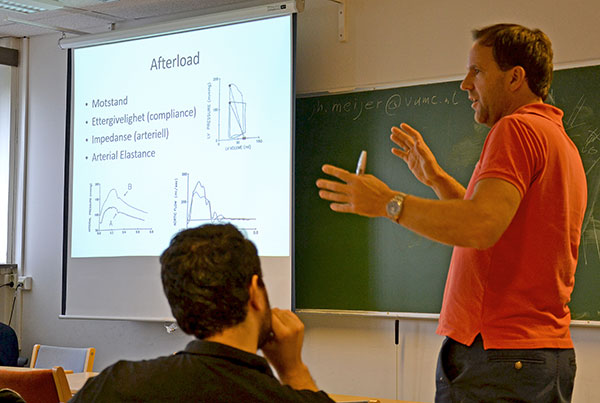
Cardiologist Hans Henrik Odland gave an interesting lecture on cardiology. The function of the heart, the circulatory system and related diseases were topics that apparently were of great interest to the students, who had many questions. Fun to learn something outside the traditional physics curriculum, although there is obviously a lot of complex physics also in this field.
ICG lecture
September 22, 2015
 |
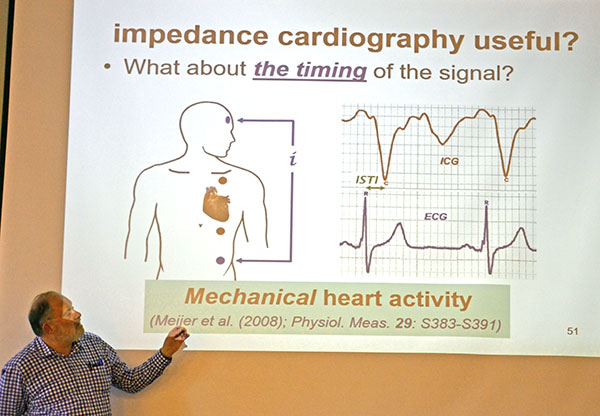
Today, Dr. Jan H. Meijer from VU, Amsterdam gave a two-hour lecture on impedance basics, the vascular system and measurement of impedance cardiography (ICG). He showed the different features and parameters of the ICG curve and its derivative and gave examples of clinical investigations with this method. Dr. Meijer has also brought his own ICG instrument and tomorrow the students will be able to use this equipment and get practical experience with ICG recording. |
ECG module
September 15, 2015
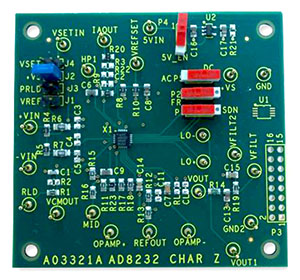 |
The work on the construction of a module for electrocardipgraphy (ECG) measurements has started. It wil be based on an AD8232 evaluation kit. The main challenge here will probably be the need for a sharp and precise 50 Hz notch filter and the signal may also need some additional amplification. |
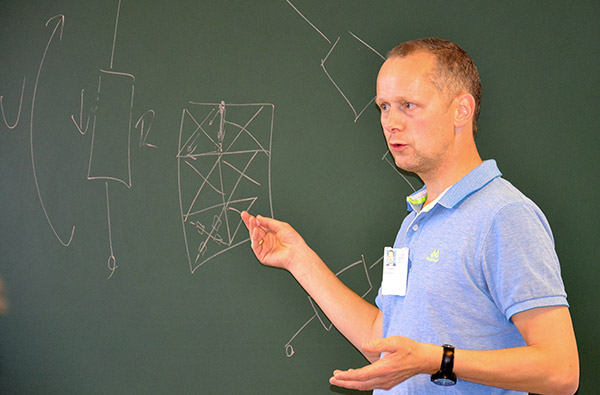
Introduction to finite element modeling
September 9, 2015
Fred-Johan Pettersen gave a crash course in using Comsol Multiphysics for modeling four-electrode impedance measurements on the thorax. He has made a model for the students that serves as a convenient starting point for calculating impedance changes during the heart cycle and for testing the channel separation between the two measuring sites (heart and upper arm).
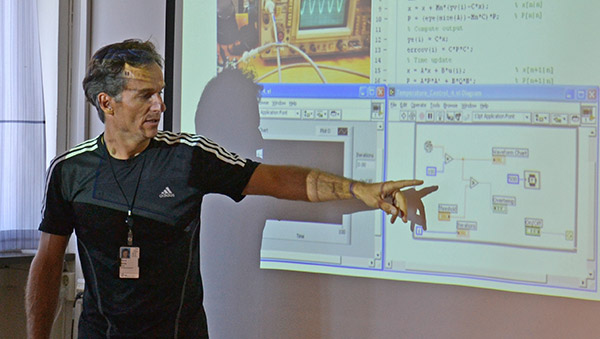
Instrumentation with LabVIEW
September 9, 2015
Today, Håvard Kalvøy gave an introductory lecture on instrumentation with LabVIEW. This graphical programing language is particularly developed for instrumentation purposes and should be well suited for this year’s Sensorama project. Dr. Kalvøy used his own needle positioning instrumentation as an example of how bioimpedance measurements can be done by combining a commercial data acquisition card with LabVIEW.
The project has started
September 2, 2015
Groups have now been formed and each group will be the main responsible for a specific part of the project. Each student will participate in 2-3 groups and the goups will always update the other students about their ongoing work.
The goups are:
A. Literature search
B. Building the instrument
C. Writing software for the instrument
D. FEM modeling and testing channel separation
E. Recruiting and organizing volunteers
F. Doing measurements
G. Analyzing results (calculating parameters and doing statistics)
H. Modeling the time delay
I. Writing the article