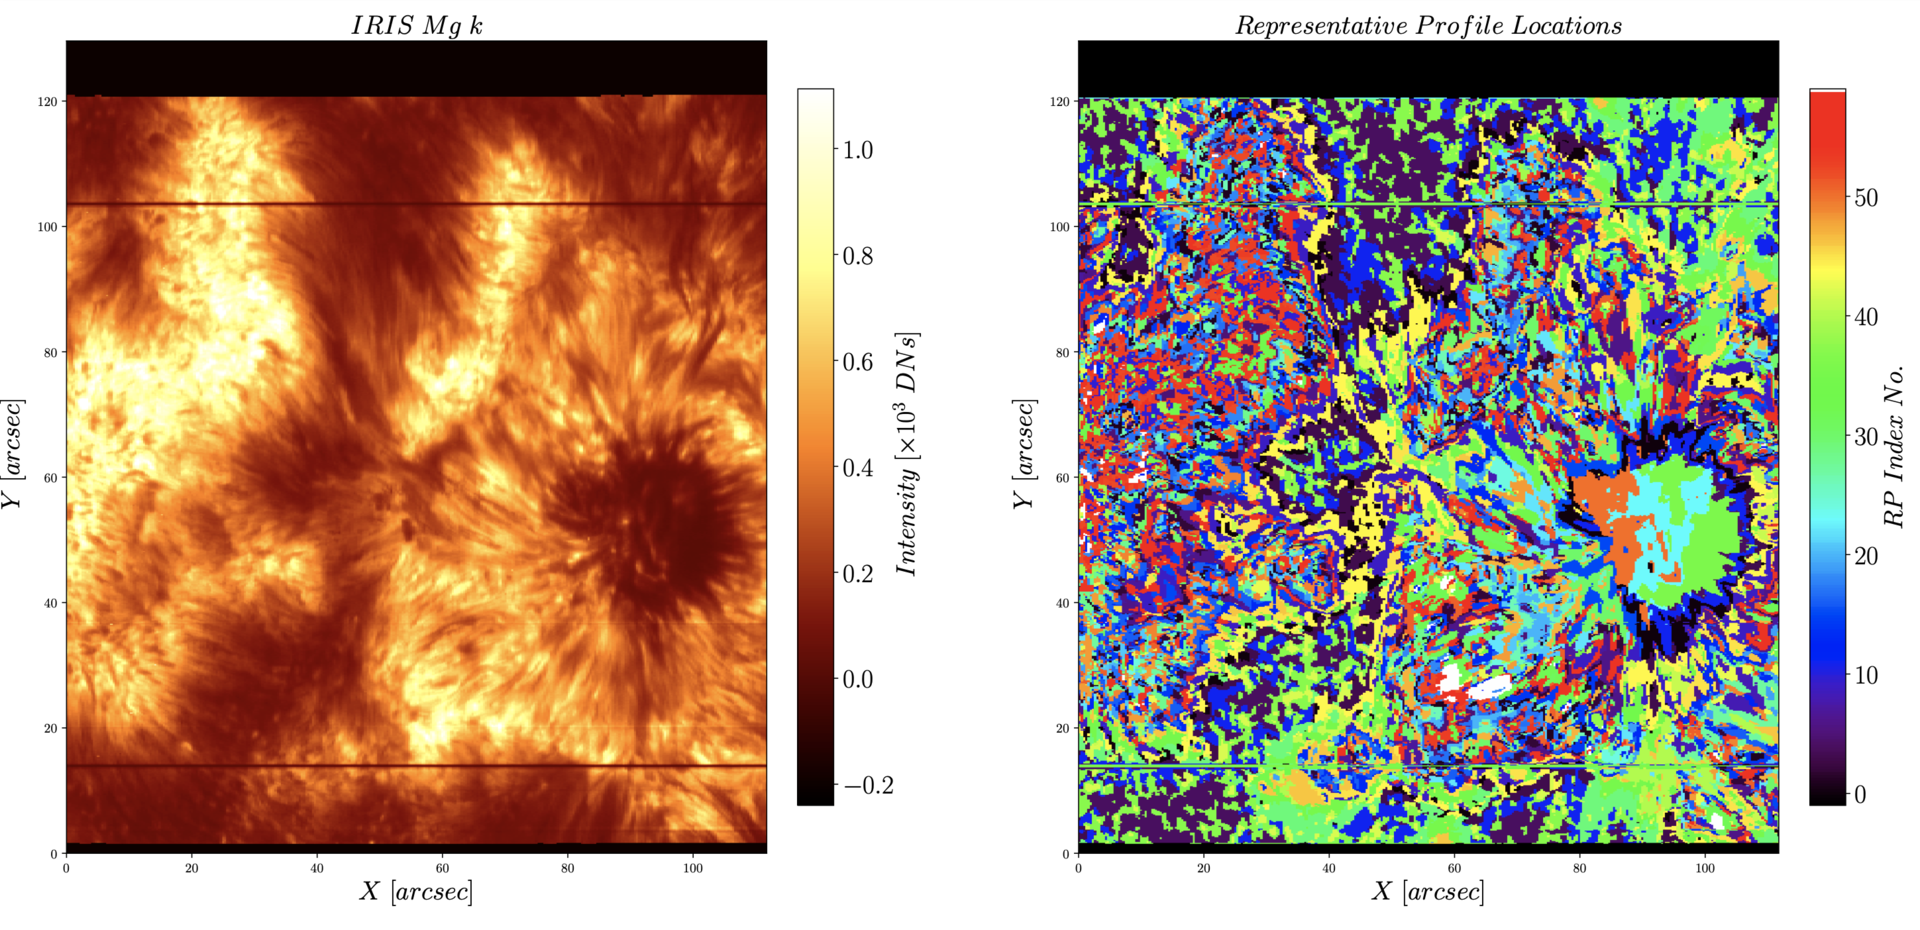
The Interface Region Imaging Spectrograph (IRIS) is a NASA Small Explorer that is focused on high-resolution ultraviolet observations of the chromosphere, transition region, and flaring corona. I will provide an overview of several different results based on IRIS data. I will show a new approach, based on machine learning techniques and the Stockholm Inversion Code (STiC), that provides, in a matter of a few minutes (instead of millions of minutes), temperatures, densities, velocities and non-thermal motions as a function of height for any IRIS map of the Mg II h & k lines. In the second part of my talk, I will also discuss the non-thermal broadening of the Fe XXI 1354 A line during flares, and show that the excessive broadening during flares cannot be explained by superposition of evaporative flows on unresolved and neighboring field lines, a commonly proposed mechanism. If there is time, I will also briefly discuss recent observations of plage using IRIS and ALMA.