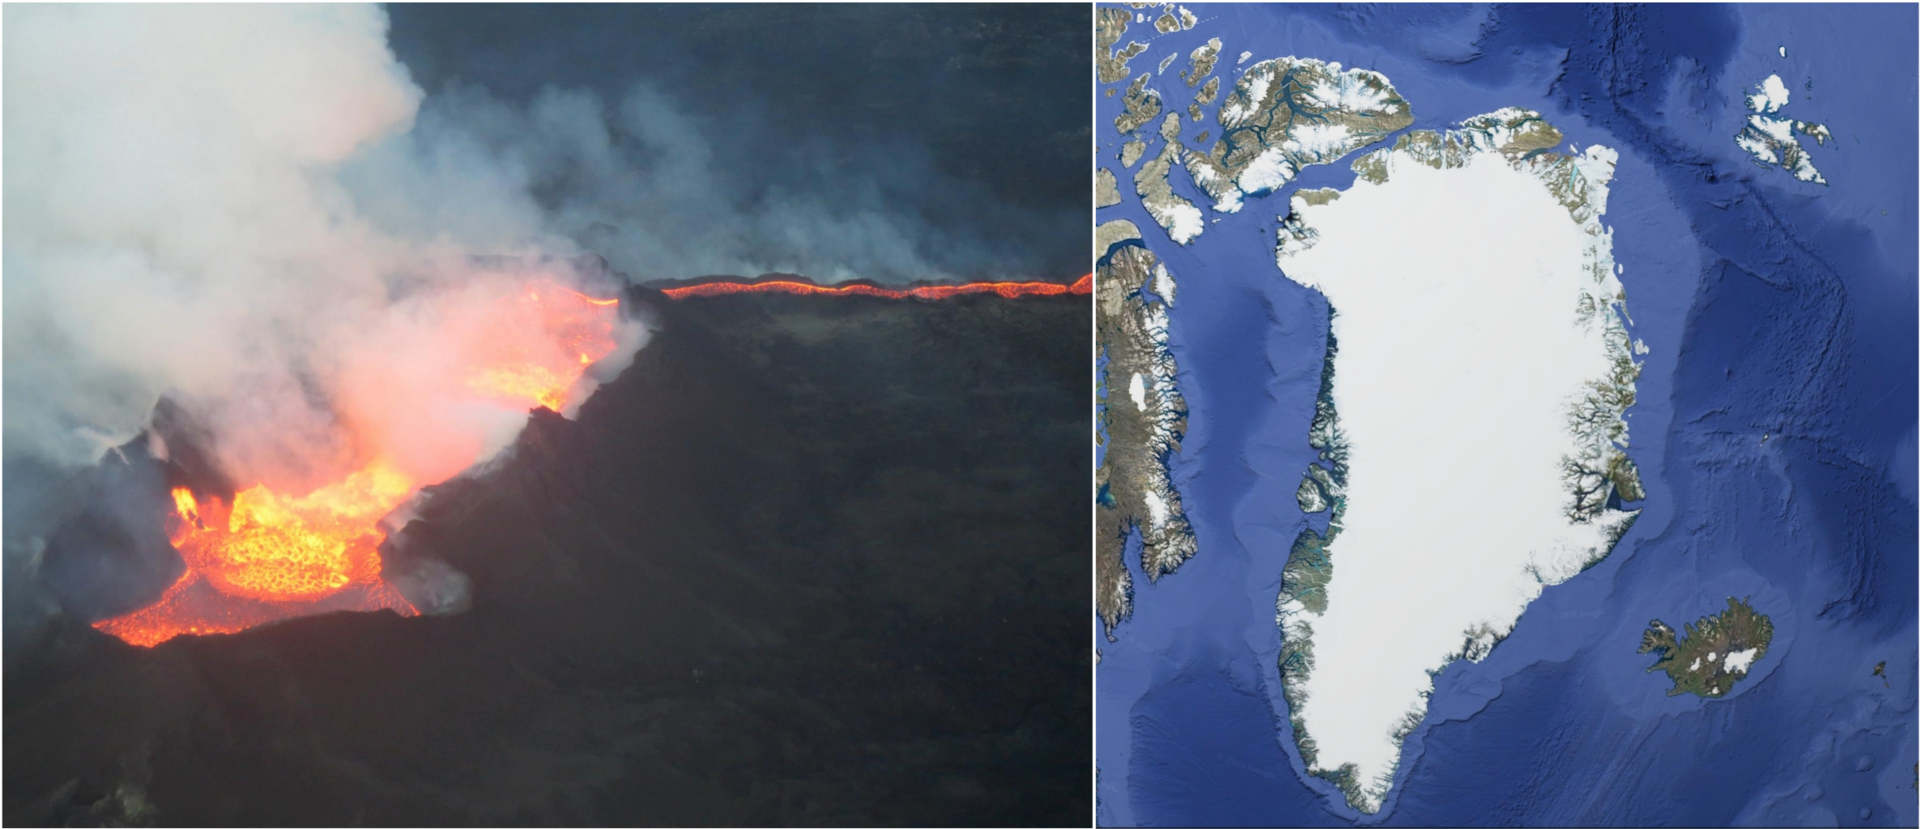
Iceland is a fascinating place, especially from a geological perspective. It is located directly at a mid-ocean spreading centre between two tectonic plates (North America and Eurasia), and it is fed by a strong, long-lived upwelling of hot material that originates from the Earth’s deep interior.
This "Iceland plume" is more or less stationary through time, while the tectonic plates at the surface move slowly over it. As a consequence, reconstructions of plate motions show that Greenland passed over the Iceland Plume about 50-90 million years ago. However, very different paths have been proposed. Part of this reason is that, unlike Iceland, Greenland shows only a few signs of erupted magmas, most of which are erupted at the coasts. Most of the plume‘s path remains hidden beneath the ice… at least at first sight.
With the exception of continental flood basalts (like the Siberian Traps) there are often no volcanoes along continental plume tracks. This is due to thick lithosphere preventing the magma to pierce through. However, a hot, buoyant mantle plume does interact with the base of the continental lithosphere along all of its path. In a new study, CEED scientists Björn Heyn and Clint Conrad modelled this plume-lithosphere interaction with numerical computations. The results are crucial for understanding how we can identify continental plume tracks in the absence of magmatic evidence. More specifically, the new study looks at the connection between plume-related surface heat flux and basal erosion of lithosphere that is visible in seismic tomography.
The emplacement of hotter than average material, in combination with mechanical erosion of the colder and stiffer continental lithosphere by the hot plume, reduces the lithosphere thickness by up to several tens of kilometers. This thinning can be measured by seismic waves, because waves travel significantly faster in the cold, stiff lithosphere than they do in the hot, soft material beneath it. The amount of thinning gives us information about the subsurface structure of the affected area, and the properties of the plume.

Since the thinned lithosphere allows hot material to rise closer to the surface compared to adjacent areas, the hotter temperatures in the thinned area result in extra heat being released at the Earth‘s surface. This heat flux can be measured, and together with the seismic observations of thinned lithosphere, shows us where the plume has passed beneath the lithosphere, even if volcanic eruptions are missing, as they are in the interior of Greenland. Since the magnitudes of heat flux and lithosphere thinning are related to each other, we can further predict a likely heat flux anomaly if we know the lithosphere thinning, or vice versa.
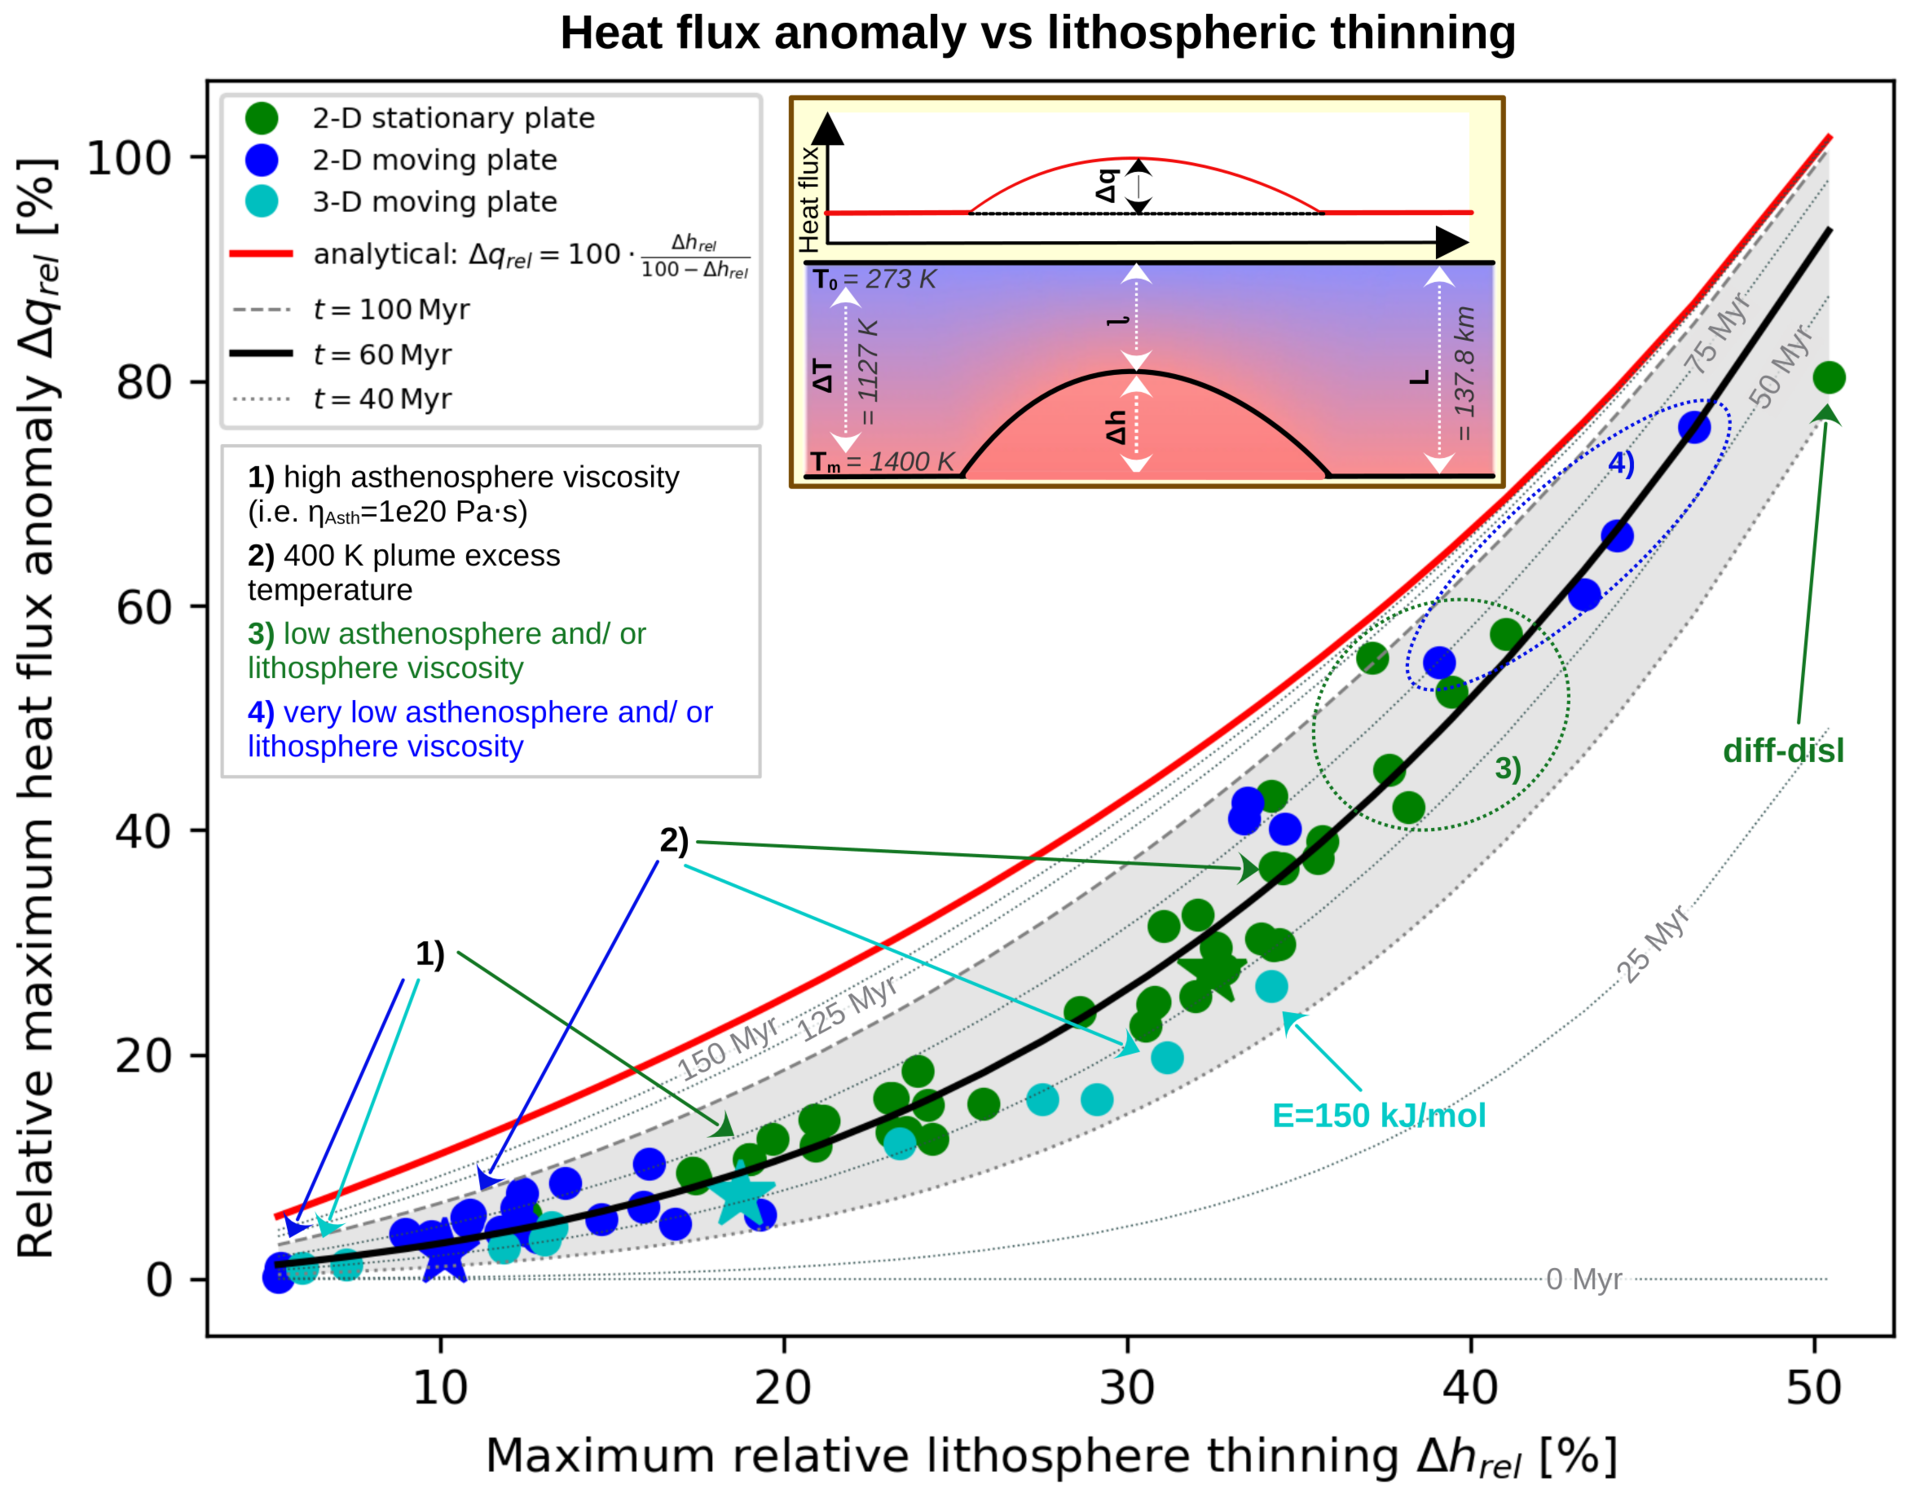
The possibility of predicting one observable from the other (e.g. thinned lithosphere or heat flow) is especially important because the resultant anomalies are not observed at the same time. While the lithosphere thinning is strongest at the time that the plume is beneath the respective area (as is the “visible” volcanism in Iceland today), the heat flux will reach a maximum about 40-140 million years later. Thus, we can estimate the expected maximum heat flux anomaly in Greenland based on today’s lithosphere thinning, but the heat flux beneath Greenland‘s ice will continue to increase for another 40-60 million years. This is important, because basal heat flux is an important contributor to the dynamics of an ice sheet, and we expect a faster rate of ice melting in Greenland‘s (distant) future!
Contact details: Björn Heyn, b.h.heyn@geo.uio.no
Publication details: Björn Heyn and Clint Conrad (2022), On the relation between basal erosion of the lithosphere and surface heat flux for continental plume tracks, Geophysical Research Letters, doi:10.1029/2022GL098003