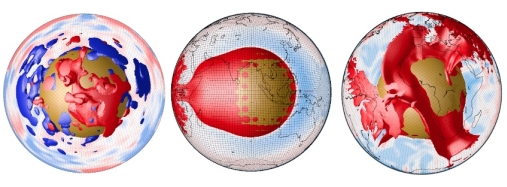
Left - shear-wave velocity isosurfaces (red is -0.6% and blue is +0.6% dVs) for the tomographic model S20RTS, showing two large, anomalous, antipodal velocity structures in the lower mantle. Centre - a numerical convection model of a degree-1 mantle structure with one single large upwelling (LLSVP) beneath Africa. Right: a numerical convection model showing the present-day temperature structure (red=hot) resulting from a thermochemical calculation investigating the effect of initial temperature condition on the formation of LLSVPs.
Virtual earth: Illustration: CEED