The general presence of the events in the dataset were in many cases known, but now they could be clearly observed, measured, monitored and analyzed. The study is a first step towards handling big volumes of Earth observation data to study glaciers.
The satellite images used is in the study are collected by the Landsat-8 satellite, which is in orbit since 2013. It has been acquiring images of the Earth with a pixel-resolution of 15 meters and is freely available. The capabilities of extracting glacier flow from Landsat imagery has been around for some time, but current supercomputers are now able to process satellite imagery minutes after they have been send back to Earth. The automatic raw displacements products (called GoLIVE data) are also made freely available.
Hence the creation of snap shots of glacier flow is not the bottle neck anymore, but the challenge has shifted towards filtering and composing coherent time-series.
This post-processing becomes too tedious if not done automatically as the number of satellite scenes has grown tremendously. It is this step within the Earth observation pipeline, which the researchers of this study have tackled in their study.
Earth observations and the art of studying a continuously changing glacier
Demonstrating the new methodology, the researchers choose a region that covered several mountain ranges situated in Alaska and Yukon. Within this region, a large variety of glacier types exist; inland most glacier terminate on land, but many of these seem to experience episodic flow variations.
Glaciers along the coast mostly terminate into the ocean and flow variations are linked to the complicated interaction between the ocean and circulation thereof in the glacier fjords. Generating monthly velocity time series is of interest as change in flow behavior can occur rapidly in this region.
Before this study, the state of the art was either to have high resolution time-series at one dedicated glacier, or construct mean annual velocities over a larger area. With the new processing method the researchers were able to look at a lot of glaciers in high detail. For example, Klutlan Glacier at the border of Alaska and Yukon started to speed-up, and with help of the new dataset the evolution of this surge can be understood clearly.
– We could clearly see that a speed-up started in the main trunk of the glacier and propagated downwards. But also ice situated higher in the valley was affected and was drawn down and increased in speed,
states Bas Altena, one of the developers behind the new method. In 2018 he got an ESA Living Planet Fellowship grant from the European Space Agency (ESA) to carry out a research project about flows in glaciers.
The Klutlan movie (above) show the new time series includes a velocity estimate every 300 meters on the ground at a monthly time step. Because of this relatively high resolution, ice dynamics of smaller glaciers can also be observed. For example, in the lower right corner of the Klutlan movie, some smaller glaciers join into a main valley and seem to compete in transporting their ice through the funnel-like valley.
Velocity and dynamics of a glacier
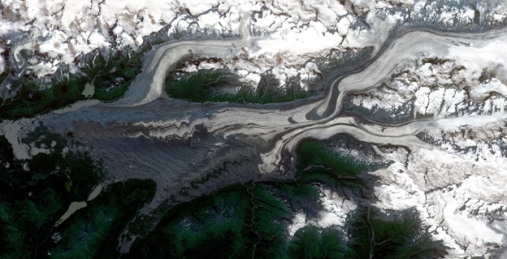
Glaciologists were aware of such dynamics, as the moraines on the surface have wiggles, but now they are able to observe and understand from spaces the process and forces that generate these curves. Another fascinating example comes from one of the larger and iconic glaciers in the region; Malaspina Glacier, see movie below.
This glacier gets ice from a large icefield, then goes through a narrow valley and spreads out into a gigantic lobe. Its surface has many wiggles and jiggles (that by themselves are fascinating to see). However, by looking at the velocity evolution, the seasonal velocity, as well as inter-annual pulsating flow seems to be driving this natural art on the glacier surface.
Apart from being a great visualization and discovering tool for the dynamics of the glaciers the dataset has already found its way to other researchers within the MN-faculty, University of Oslo and elsewhere. Colleagues from the interdisciplinary research group Earthflows study processes at the interface between ice and rock in detail and the time-series gave them the measurements needed to test their hypothesis about glacier flow.
Looking into the future, the generated or processed time series is a demonstration of what lies ahead of us. If one keeps in mind the current results are a composition of data from only one satellite, while since 2015 the twin mission of Sentinel-2 has started to acquire additional imagery of the Earth as well,
– The European satellite Sentinel-2 constellation has a higher spatial resolution and passes over much more frequently than the Landsat satellite. If these data sources are combined, an even clearer picture of our changing frozen environment can be extracted. Over the Saint Elias Mountains, Kluane, or any other remote area on the Earth, according to Bas Altena.
Bas Altena is a researcher at Department of Geosciences, University of Oslo, and leader of the research project with title Short-term movements in the Cryosphere (ICEFLOW).
Reference:
Altena, B., Scambos, T., Fahnestock, M., & A. Kääb. 2019. Extracting recent short-term glacier velocity evolution over Southern Alaska and the Yukon from a large collection of Landsat data. The Cryosphere, 13, 1–20. DOI: 10.5194/tc-13-1-2019