About the group

Geomatics includes the collection, management, integration, representation, analysis, modeling, and visualization of geographically-referenced information. We collect data using a range of ground-based, aerial, or space-borne sensors and systems, such as Global Satellite Navigation Systems (GNSS, GPS), unmanned aerial systems ("drones"), or various satellites. We manage and analyze data in geographical information systems (GIS) and a range of own software packages.

We teach general geomatic tools and techniques, and use them in all our research groups, related to environmental studies, Earth's water cycle (ice, water, atmosphere), water resources, Earth surface processes and natural hazards. Examples of such applications are hazards related to slope instability, glacier mapping and change detection, permafrost modeling, snow distribution and landform analysis.
Research Group Leaders:

Professor Andreas Max Kääb, and Professor Bernd Etzelmüller, both from Department of Geosciences

Studies in geomatics and remote sensing at University of Oslo:

► Introductions to geomatics are part of the BSc studies.
► See also the study option geomatics in the MSc Geosciences program.

Our project fields in brief:

Image: Snow thickness measurements
Snow thickness measurements.

► Drone lab

  
Image: Visualization of satellite laser footprints
Visualization of satellite laser footprints

► Air- and space-borne remote sensing of the cryosphere (glaciers, snow, permafrost)

  • Glacier mapping and change detection
  • Elevation and volume changes
  • Glacier flow and rock glacier surface velocities
  • Laser altimetry
  • Machine learning
  • Climate change impacts, glacial water resources and glacier-related hazards
  
Image: Glacier lakes and outburst traces, Bhutan
Glacier lakes and outburst traces, Bhutan.

► Remote sensing of natural hazards

  • Glacier-related hazards (floods, avalanches, surges, etc.)
  • Permafrost-related hazards (slope instability, debris flows, rapid thermokarst, etc.)
  • Landslides
  • Hazard assessment and disaster management
  
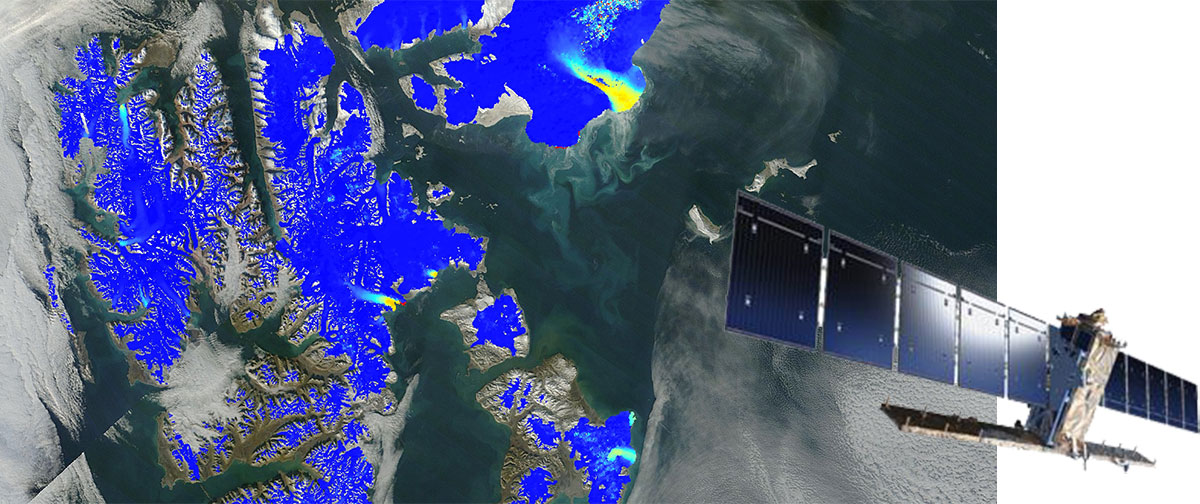
Image: SAR interferogram, Austfonna (Svalbard)
SAR interferogram, Austfonna (Svalbard).

► Sythetic Aperture Radar (SAR) and SAR-interferometry

  • DEMs from spaceborne SAR
  • Differential SAR interferometry, persistent scatterer interferometry
  • SAR offset tracking
  
Image: River ice velocities, Alaska
River ice velocities, Alaska.

► Digital photogrammetry and image matching

  • Terrain displacements: algorithms and methods for optical and radar image matching
  • DEM generation, structure-from-motion, elevation changes
  • Applications to glaciers, ice shelves, permafrost, landslides, rivers, etc.
  
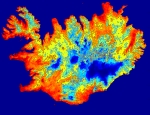
image: Average LST; Iceland (MODIS).
Average LST; Iceland (MODIS).

► Remote sensing of Land Surface Temperatures (LST)

  • MODIS LST daily measurements @ 1km resolution worldwide
  • 10 year time series
  • Input for thermal permafrost modeling
  
Image: Global permafrost model
Global permafrost model

► Thermal permafrost models

  • Spatially distributed modeling of ground temperatures based on surface data sets (e.g. air temperature, snow depth)
  • Models of different complexity – Cryogrid 1, 2, 3
  • Model runs on HPC Computing Cluster.
  
Image: ESA Earth Explorer 10 mission Harmony. Illustration: ESA
ESA Earth Explorer 10 mission –Harmony

► Development of sensors and missions

  • Satellite mission development
  • Development of sensor models
  • Sensor development
  • Calibration and validation