Bioinformatics: Associating gene regulatory networks with 3D genome information
The regulation of gene expression involves a complicated network of interacting elements. At the core of this network are transcription factor complexes, promoters, inhibitors, and enhancers, that all play a role in regulation the transcription of genes into mRNA. What emerges is not a single set of interactions, or even a single pathway, but a complex network of interacting genes and gene products. We can model these networks using computational tools developed in our lab that integrate prior knowledge on potential transcription factor binding with gene expression data. These tools have been valuable in our understanding of how genes are regulated in different tissues, and in modeling the disruption of gene regulation in diseases such as cancer.
However, several other factors play a role in regulating gene expression, and we are working on expanding our network models to better understand the full picture of gene regulation. A very important factor in how genes are regulated is how chromosomes are organized in the cell, or the 3D genomic architecture of the cell. For example, if promoters and enhancers are brought into close proximity with one another, they form loops across large distances, and can thereby change the regulatory landscape. These loops are embedded within so-called topologically associating domains that organize the genome into regulatory neighborhoods.
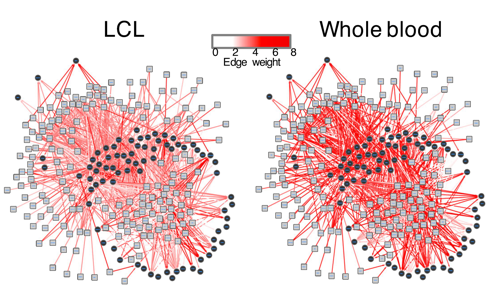
Figure 1: Gene regulatory networks modeled on different cell lines. In this project, we will integrate such networks with 3D genome information.
This Master’s research project aims to identify the link between how genomic location results in differences in gene expression. In specific, the student will study the effect of regulatory neighborhoods on our network models. Two questions we would like to answer with this project are:
1. Can we capture spatial location of the 3D genome with our current network models?
2. Can we integrate the 3D genome architecture with our current models to make better estimates on gene regulation?
To answer these questions, the student will analyze gene regulatory networks for 2 human cell lines and 10 tissues for which we have 3D genome structures available. The student will estimate network centrality measures, such as gene degree, to get an overall measure of gene regulation in each a specific tissue. They will then perform statistical analyses to understand whether genes located in topologically associating domain (TAD) cliques are associated with differential regulation in the network models. Finally, the student will extend our network models by integrating information on the 3D genome architecture into the input data that are used to model gene regulatory networks, and will assess whether this improves performance of identifying differential regulation.
Emneord:
Bioinformatics,
networks
Publisert 3. feb. 2020 12:38
- Sist endret 3. feb. 2020 12:38